Get a Sneak Peek at Trends, Valuation Multiples, and Operation Ratios for Small, Main Street Private Companies
BIZCOMPS, a comprehensive online database with financial details on small, Main Street private companies, has been recently updated with new transactions, and the current BIZCOMPS/BVR Deal Review (BDR), exclusively for subscribers, is now available. This special publication analyzes general trends, valuation multiples, and operating ratios for transactions in the database. Get a sneak peek at the Summer 2021 issue with highlights including harmonic mean and median sale price, median SDE/rent, and more.
BIZCOMPS Summary Information

Exhibit 1 provides summary information by year for the BIZCOMPS database. It’s clear that, in years following the financial recession in 2009, the number of closed business sales trended upward until 2014. However, since 2018, the number of closed business sales being submitted to the BIZCOMPS database has noticeably fallen. Since 2015, the median sale price has increased in each year, reaching its highest median sales price in 2020, at $303,000.

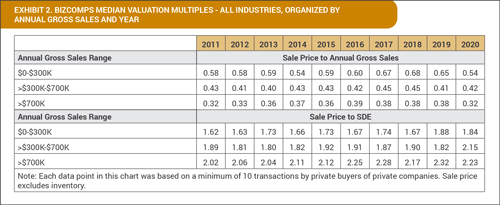
Exhibit 2 presents, by year, two median valuation multiples for all industries based on three annual gross sales ranges. In 2020, the multiples for four of the six categories declined from their 2019 levels, with only the multiples for companies with gross sales between $300,000 and $700,000 seeing an increase, with the sale price-to-annual gross multiple rising to 0.42x and the sale price-to-SDE multiple rising to 2.15x.
Harmonic mean and median sale price

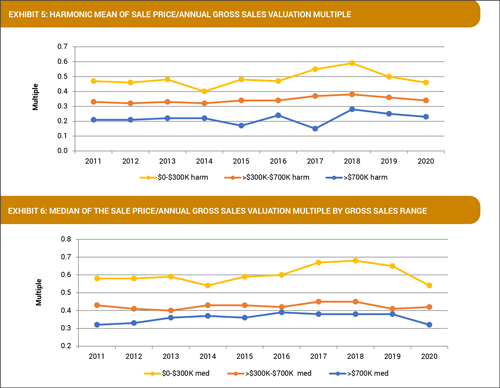
Exhibits 5 and 6 represent the harmonic mean and the median sale price-to-annual gross sales multiple by annual gross sales ranges and year. The harmonic mean is highlighted from 2011 to 2020 across all three gross sales categories. In recent years, companies with revenues up to $300,000 saw their harmonic mean multiple rise in 2017 and reach a peak in 2018, at 0.59x, only to see it decline the next two years, falling to 0.46x in 2020. The median sale price-to-annual gross sales multiple followed a similar trend, rising in 2017, reaching its peak in 2018, at 0.68x, then falling in 2019 and 2020, to 0.54x. Companies with gross sales between $300,000 and $700,000 saw the harmonic mean annual gross sales multiple decline to 0.34x in 2020, while the median annual gross sales multiple ticked up to 0.42x. Companies with annual gross sales greater than $700,000 have seen the harmonic mean sale price-to-annual gross sales multiple reach its highest value in 2018, at 0.28x, but decline in the ensuing two years, to 0.23x in 2020. The median annual gross sales figure fell to its lowest multiple in 2020, to 0.32x.
Median SDE/rent

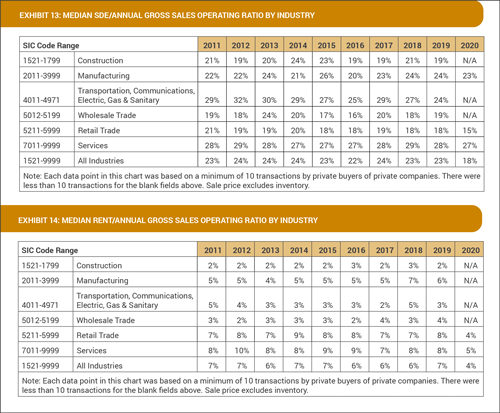
Exhibit 13 presents the median SDE-to-annual gross sales ratio based on major industry groups (as identified by SIC code). All three industries meeting the minimum number of transactions criteria saw their median SDE-to-annual gross sales ratio decline in 2020, while the “All Industries” category declined to 18%.
Exhibit 14 presents the median rent-to-annual gross sales ratio based on major industry groups (as identified by SIC code). In 2020, the median rent-to-annual gross sales ratio for the retail trade industry decreased to 4% and the one for the services industry reached its lowest percentage, at 5%. In 2020, the median rent-to-annual gross sales ratio for the “All Industries” category fell to 4%, its lowest point (in this case, a low value is more favorable) after being at 6% or 7% in each of the past 10 years.
Download the full Summer 2021 issue for more
Download the complete Summer 2021 issue of the BDR to see more stats on operating ratios, key economic variables, economic outlook, and much more. Plus, learn about an annual subscription to BIZCOMPS, the most thorough and accurate resource for financial details on “Main Street” private companies. This must-have tool includes more than 15,450 deals dating back to 2000 and removes marketplace uncertainty with access to meaningful financial information.
