How Did the Pandemic Impact EBITDA Multiples in 2020? Explore a 12-Month Snapshot in the DealStats Value Index
With the COVID-19 pandemic putting a stranglehold on the U.S. economy for most of 2020 and causing an unprecedented economic impact on small businesses, DealStats Value Index (DVI) captured the 12-month snapshot on how earnings before interest, taxes, depreciation, and amortization (EBITDA) multiples have trended.
Business Valuation Resources recently published EBITDA multiples by industry in our DVI, which presents an aggregated summary of valuation multiples and profit margins for over 40,000 sold private companies listed in our DealStats platform. Below are some of the highlights from the report.
2020 EBITDA multiples returned to levels near historical norms
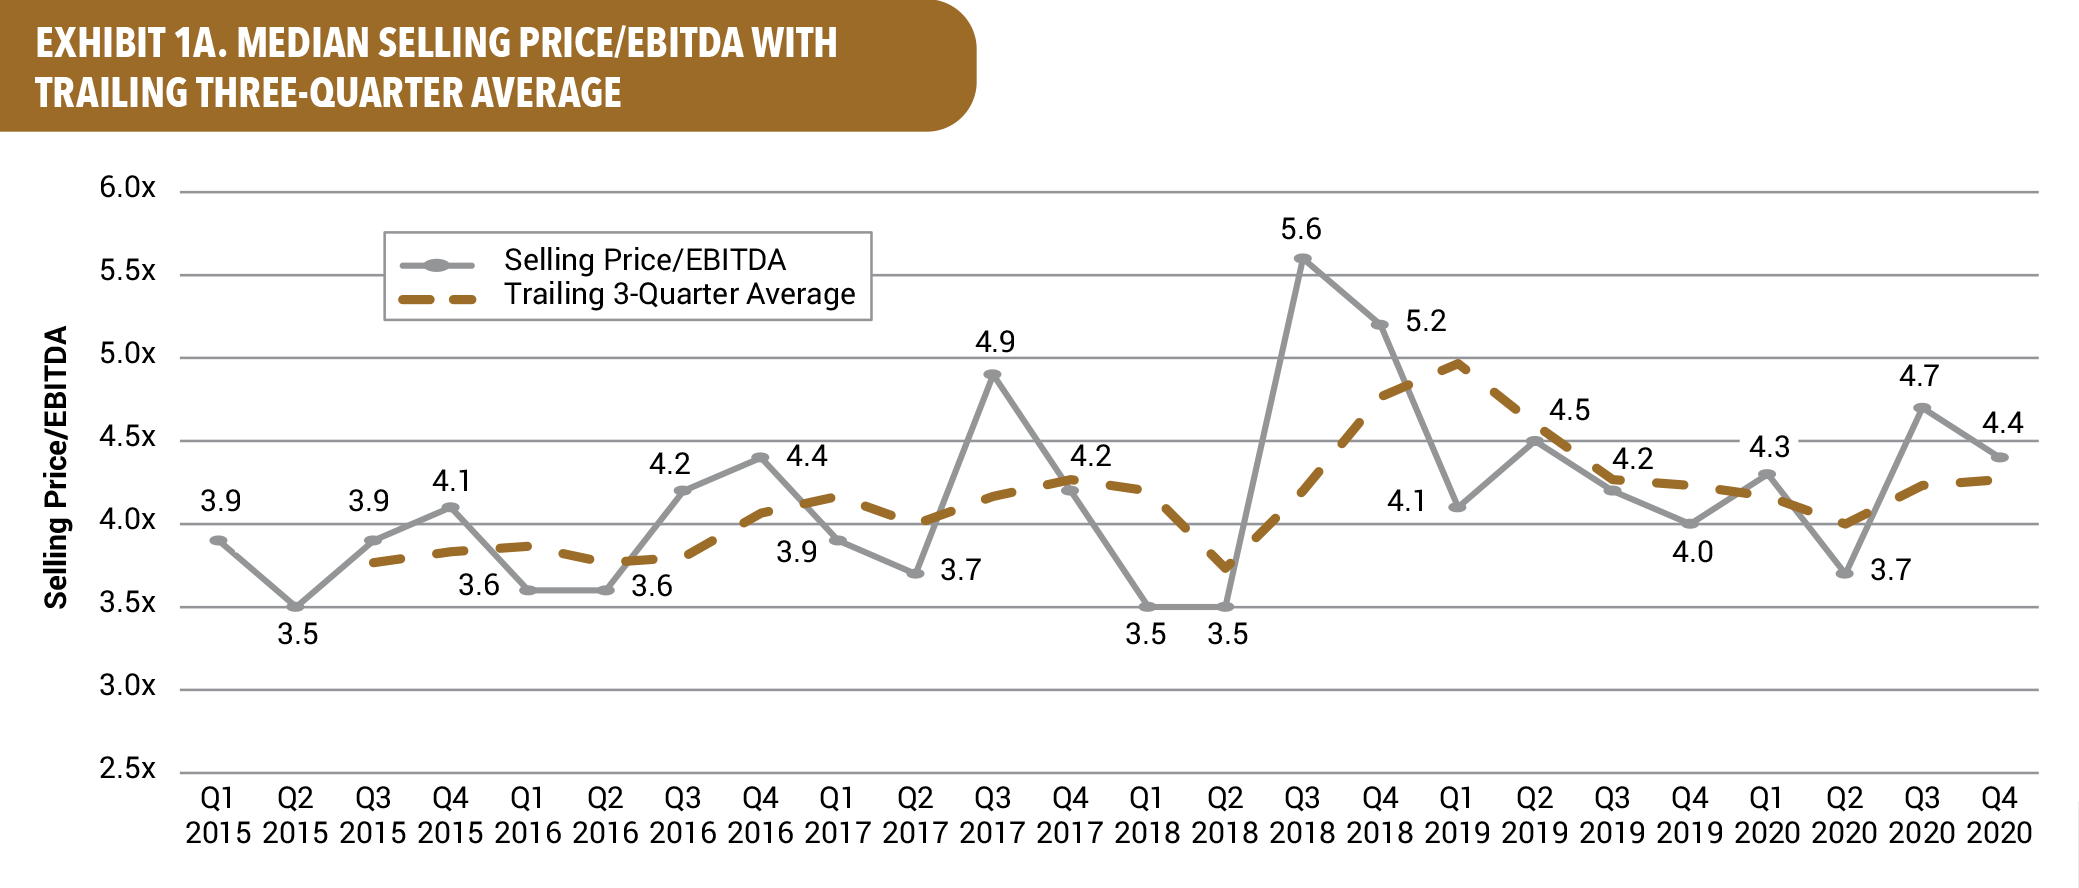
Taking into consideration the uncertainty the onset of the spread of the virus caused early in the second quarter of 2020, sellers appeared to have initially forecasted a worst-case scenario, with EBITDA multiples falling to 3.7x, their lowest level since the second quarter of 2018. The decline came after the median EBITDA multiple in the first quarter of 2020 came in at its highest first-quarter level, 4.3x, over the six-year period illustrated in Exhibit 1A . However, by the second half of 2020, EBITDA multiples returned to levels near historical norms, at 4.7x in the third quarter and 4.4x in the fourth quarter of 2020. In doing so, this continued the trend of the median EBITDA multiple reporting at its highest level during the second half of the year as seen from 2015 to 2018 and in 2020.

2020 experienced volatility in pricing multiples not seen in recent years
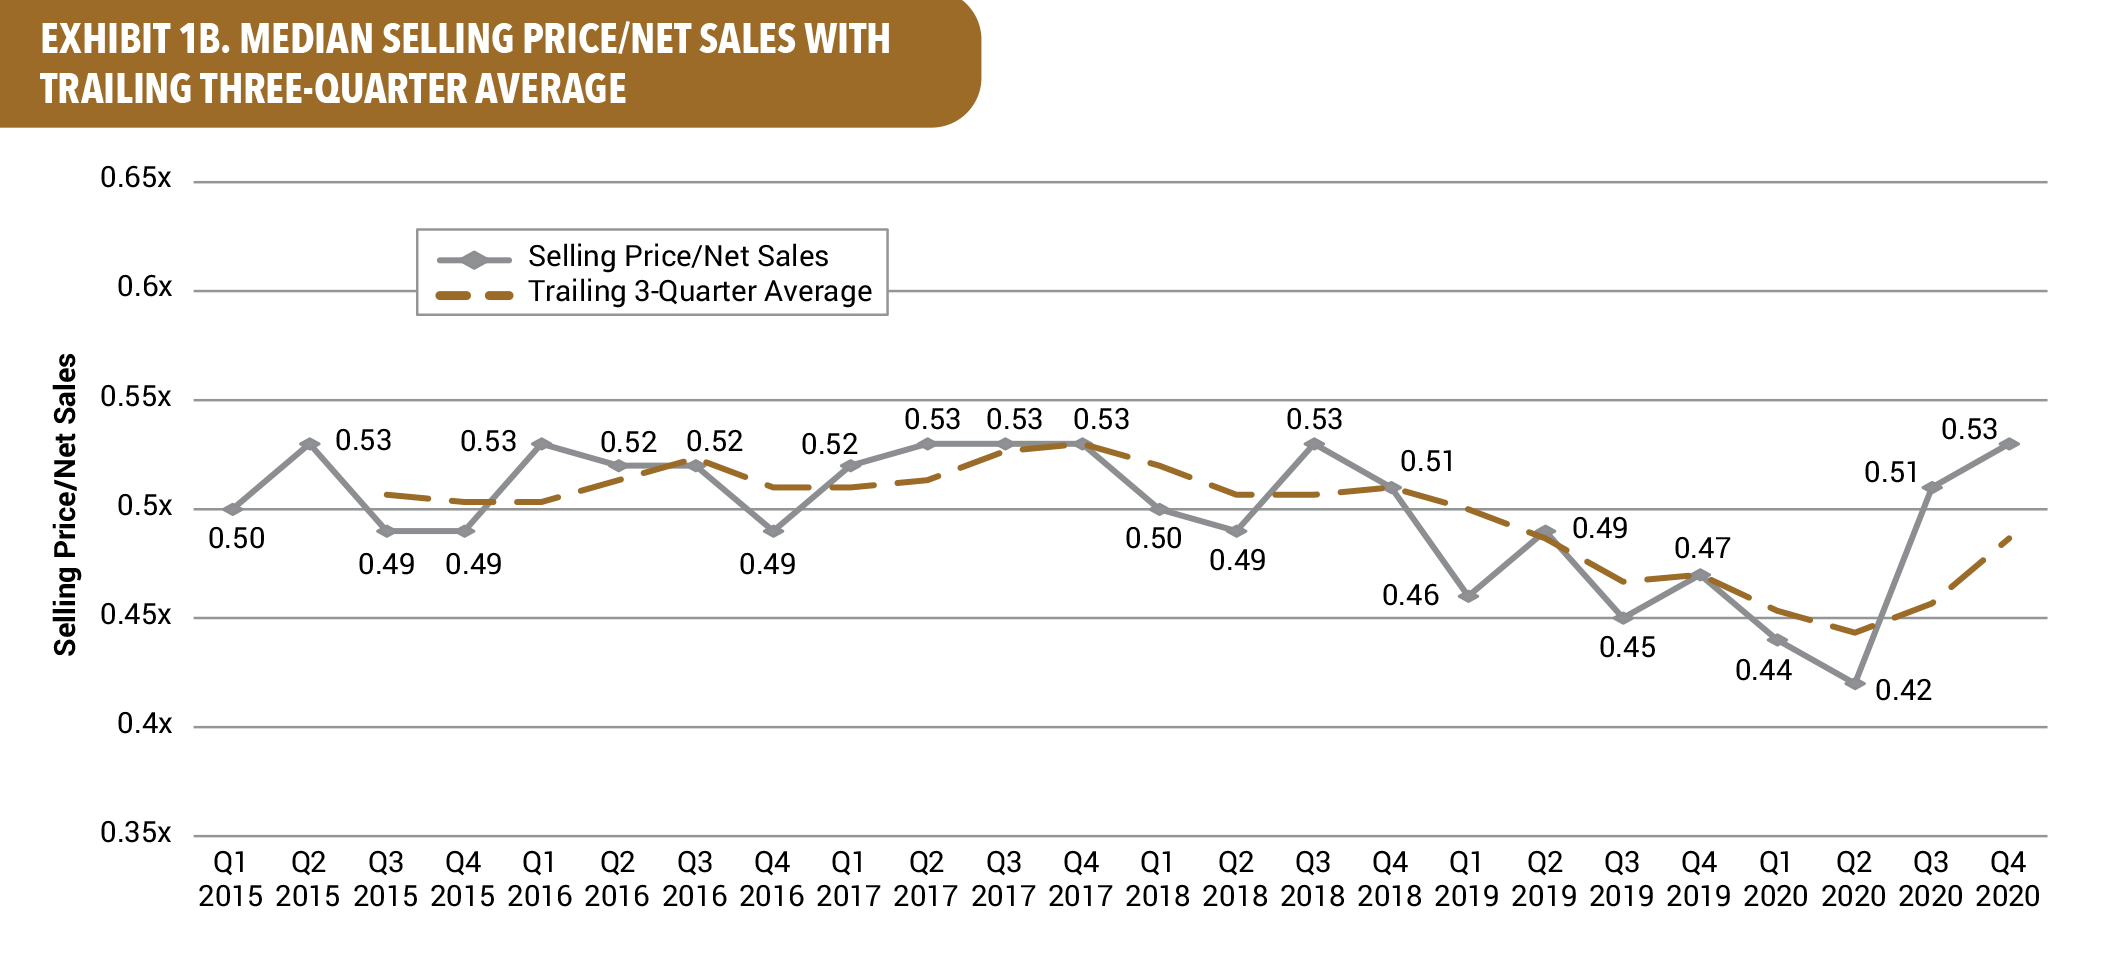
The net sales multiple from 2015 to 2020 in Exhibit 1B best highlights the dramatic shifts in the median net sales multiple over the course of 2020 when compared to prior years. Even though the net sales multiple had been trending lower since the fourth quarter of 2018, the second-quarter 2020 multiple fell to its lowest level, 0.42x, with the onset of the coronavirus serving as the culprit for the uncertainty over the damages it caused impacting valuations. However, by the third quarter of 2020, with economic indicators such as retail sales, small-business optimism, Manufacturing PMI, and Services PMI, as captured in the Economic Outlook Update, pointing to a recovery in the U.S. economy, the median net sales multiple rebounded to its highest multiple since 2018, 0.51x, and continued to rise, with the fourth-quarter 2020 multiple climbing to 0.53x.

EBITDA went unchanged from the third quarter of 2020 to the fourth quarter of 2020
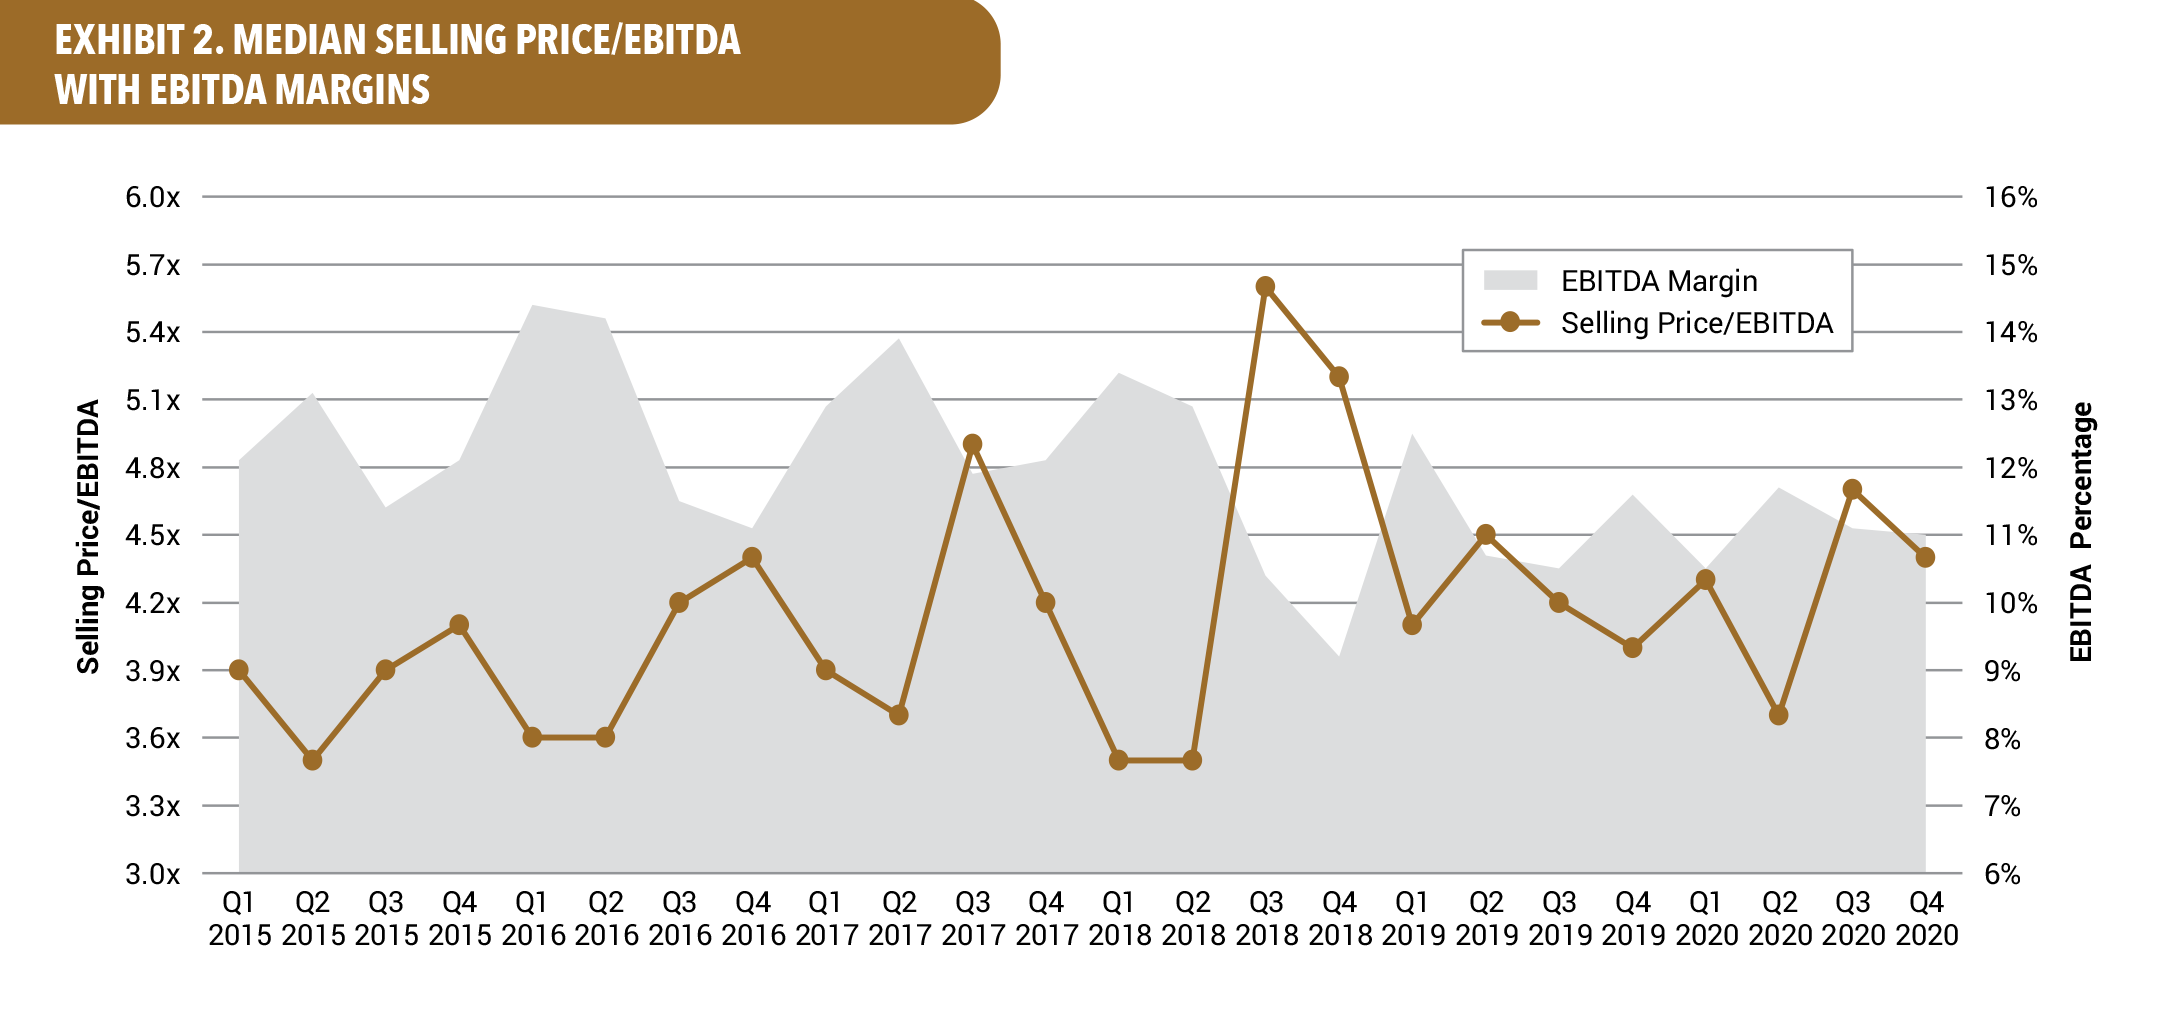
Over the past two years, EBITDA margins have seen little change, ranging from 10% to 12%. However, in the years prior, EBITDA margins fluctuated by a wider range, from 9% to 15%. The selling price-to-EBITDA multiple settled at 4.4x in the fourth quarter after the multiple had rebounded in the third quarter of 2020, to 4.7x, after seeing a significant decline in the second quarter, to 3.7x. This trend returned in the second half of 2020, although a rebound may have been more predictable following the steep decline in the second quarter of 2020 following the outbreak of the coronavirus pandemic. Heading into the first quarter of 2021, with the uncertainty surrounding the resurgence of the coronavirus pandemic and changing economic policies brought forth by a new administration, DealStats will continue to monitor the trends in EBITDA margins and multiples. Exhibit 2 highlights the trend of the EBITDA multiple moving opposite to that of EBITDA margins.

Get more analysis and trends from private-company deals
For more analysis and trends, download the 1Q 2021 DealStats Value Index Digest, an abbreviated version that is available each month when you sign up for the free ezine. The full version is available with a subscription to DealStats.
Need a more precise valuation multiple? Access a custom set of comparable transactions in the DealStats platform. Search more than 41,000 private and public deals in 947 industries and drill down to a group of sold companies similar to the business you’re evaluating. View transaction details and statistics on up to 199 data points, including valuation multiples, purchase price allocations, financial statements, and deal structures.