For the past several financial quarters, European drug companies have posted higher profit margins than their U.S. Counterparts—until now. Second quarter 2006 financial results (from a Chemical & Engineering News survey) show that U.S. pharmaceutical companies have finally pulled ahead, improving their profit margins to 22.4% compared with 22.0% for European companies.
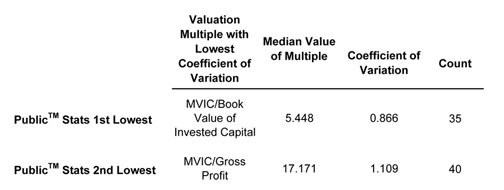
That got us thinking: What valuation multiples for public pharmaceutical companies (SIC code 2834) have the lowest coefficient of variation, and thus, might be better predictors of value? We analyzed the Public Stats™ database for valuation multiples from sales of public pharmaceutical companies. The results appear below. To learn more about these databases, visit www.BVMarketData.com.