Value Analytics User Guide
The Value Analytics Excel Add-In provides direct access to financial, equity, and company profile data for all U.S. exchange-traded companies available in the Value Analytics database. The purpose of the Add-In is to support custom financial data analysis and modeling via direct access to Value Analytics' data in the context of a Microsoft Excel spreadsheet.
Have questions? Contact our customer service team or give us a call at: 1-503-479-8200
The Value Analytics Excel Add-In is supported for the following versions of Excel:
- Excel on Mac with Microsoft 365 Subscription
- Excel on Windows with Microsoft 365 Subscription
- Excel 2019 or later on Mac
- Excel on the web
Please note that for Windows users, you must have a Microsoft 365 Subscription to install the Add-In. Once you have confirmed that your version of Excel is one of the supported versions listed above, you can install the Add-In by first navigating to the Insert tab in the Excel ribbon, and then clicking My Add-ins (Figure 1).

Figure 1: Excel Ribbon with Insert tab and My Add-ins highlighted.
After the Office Add-Ins dialogue box opens, select Store and enter "Value Analytics" in the search field. Find the Value Analytics Add-In within the search results and select Add (Figure 2).
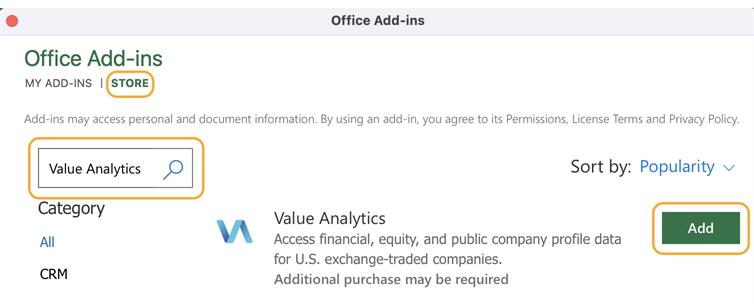
Figure 2: Add-In window with Store tab with search field highlighted.
Next, the Office Add-In store will inform you that you agree to our terms and conditions by continuing with the installation. Press Continue to finish installing the Add-In. If the installation was successful, the Value Analytics tab will be added to the Excel ribbon and you will see the following alert (Figure 3).

Figure 3: Excel Ribbon with Value Analytics tab highlighted after successful installation.
You can test if the installation was successful by navigating to the Value Analytics tab and clicking Login (Figure 4).

Figure 4: Value Analytics tab and menu options. The Value Analytics tab and Login buttons are highlighted.
After clicking the Login button, you should see the Value Analytics Login page load in the Excel task pane. However, for some combinations of Windows and Excel builds, the task pane may appear blank initially. If the task pane appears blank, you can resolve the issue by re-sizing the task pane (Figure 5).
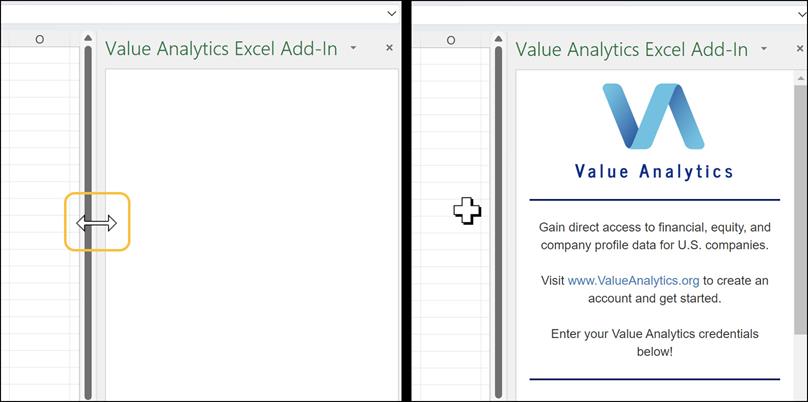
Figure 5: Blank task pane (left) compared to correctly rendered task pane (right). Resize the task pane (shown in left) to correctly render the task pane.
If the task pane appears blank after resizing the window, please contact support@valueanalytics.org
Once the Add-In has been successfully installed, you can view the Add-In menu by clicking the Value Analytics tab located on the Excel Ribbon. Figure 1 shows the location of the Value Analytics tab and the menu options.

Figure 1:Value Analytics tab and menu options. The Value Analytics tab and Login buttons are highlighted.
After clicking the Value Analytics tab, click the Login button to access the login form. Please provide the same email address and password that you used to create an account on the web application to log in to the Excel Add-in. If you have not created a Value Analytics account, please create one here to use the Excel Add-In. Figure 2 shows the login form that appears after pressing Login.
After logging in, you can start retrieving data from the Value Analytics server. Clicking the Formula Builder button will open a form that creates the function for retrieving financial and equity data from Value Analytics. Figure 1 highlights the Formula Builder button on the Value Analytics menu.

Figure 1: Value Analytics menu with Formula Builder button highlighted.
Within the Formula Builder interface, financial data are separated by category. There are a total of six categories: Balance Sheet, Cashflow Statement, Income Statement, Performance Statistics, Equity, and Pricing Multiples (Figure 2). Select a category by clicking one of the available tabs along the left side of the Formula Builder. Selecting different categories will change the field options available in the dropdown menu on the form.
Once the desired category is selected, complete the form to retrieve data. The Output Cell input specifies the cell in the Excel sheet that will be populated with financial data. Note that the Output Cell defaults to the cell that was selected prior to opening the Formula Builder Page. To specify a different Output Cell:
- Click within the Output Cell input field
- Click on the cell in the Excel sheet that you want to populate with financial data
Once you have clicked the desired cell, pressing "enter" or "tab" will move the Output Cell one row down or one column to the right, respectively. You can also specify the Output Cell by typing the cell address within the Output Cell field. To change the Output Cell by typing:
- Click within the Output Cell input field
- Type the cell address in the form
- Press "enter"
Pressing "escape" while the cursor is within the input form will deactivate the cell selection process for the Output Cell input. Figure 2 shows the Output Cell set to G3.
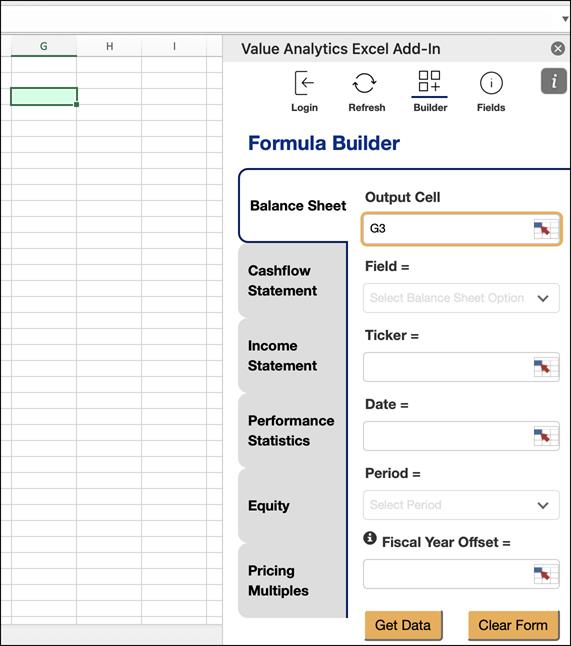
Figure 2: Formula Builder form with Output Cell set to G3
Next, select the desired field from the Field dropdown menu. The fields available within the dropdown menu represent the available fields for the selected category. Figure 3 shows the first several fields available for Balance Sheet category. You can search for specific fields within the dropdown menu search bar. Click the desired field to select it for retrieval. Changing the selected category will update the available fields in the dropdown menu.
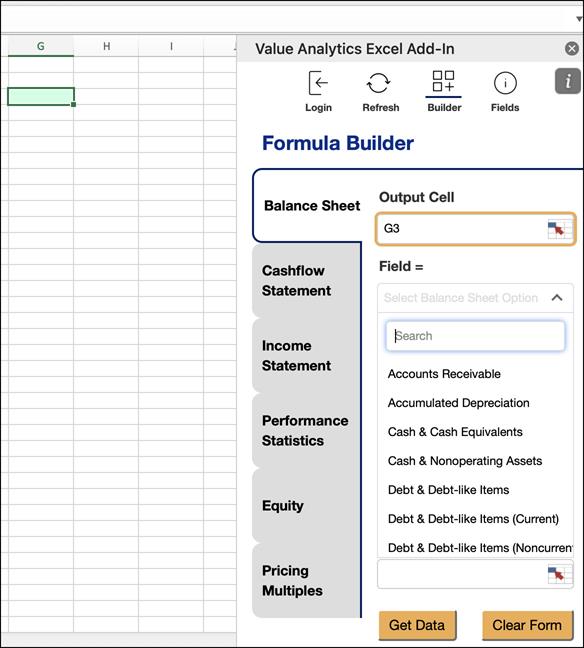
Figure 3: Formula Builder form with Field drop down menu expanded.
Once the desired field is selected, you must provide two more required parameters:
- Ticker (required): ticker associated with public company of interest
- Date (required): reference date for retrieving financial data. Date should be set to the valuation date
You can also provide two optional parameters:
- Period (optional): The financial period of annualized data. Options include Fiscal Year (FY) or Trailing Twelve Month (TTM), and by default Period is set to "FY". Period is only applicable for annualized data, i.e. Period is ignored for Equity data
- Fiscal Year Offset (optional): Offsets the fiscal year relative to provided valuation date. For example, enter "0" for last fiscal year (LFY) data relative to Date, "1" for data one fiscal year prior to LFY, etc. Fiscal Year Offset defaults to "0", and is ignored when Period is set to "TTM"
Notice that by default, Period is set to "FY", and Fiscal Year Offset is set to "0", meaning the Formula Builder will retrieve last fiscal year (LFY) data relative to Date if you do not select values for Period and Fiscal Year Offset.
To specify Ticker, Date, and Fiscal Year Offset:
- Click within the input field of the respective parameter
- Click on the cell in the Excel sheet that stores the parameter's value
The Formula Builder will prompt you if a parameter's value is incorrectly formatted. You can also specify Ticker, Date, and Fiscal Year Offset by typing the cell address within the Formula Builder. To change these parameters by typing:
- Click within the respective input fields
- Type the cell address in the form that contains the parameter's value
- Press "enter"
Pressing "esc" on your keyboard will deactivate the cell selection process for the selected input. Please note that the input fields on the Formula Builder accept cell address only, not the literal values of the parameter.
Figure 4 shows an example of a properly populated Formula Builder form. In this example, the user has a valuation Date of April 19th, 2022 and is interested in Apple Inc.'s Total Revenue for the Last Fiscal Year (LFY) prior to the valuation date. Thus, Ticker=AAPL, Date=04/19/22, Fiscal Year Offset=0 by default, Period=FY by default, and Total Revenue is selected from the dropdown menu. These inputs will retrieve the Total Revenue for Apple Inc.'s fiscal year ended September 25, 2021. If the Fiscal Year Offset=1, the function will retrieve Apple Inc.'s Total Revenue for the fiscal year ended September 25, 2020. The Fiscal Year Offset allows you to retrieve data for sequential fiscal years prior to an arbitrary valuation date without knowing when the specified firm's fiscal year ended.
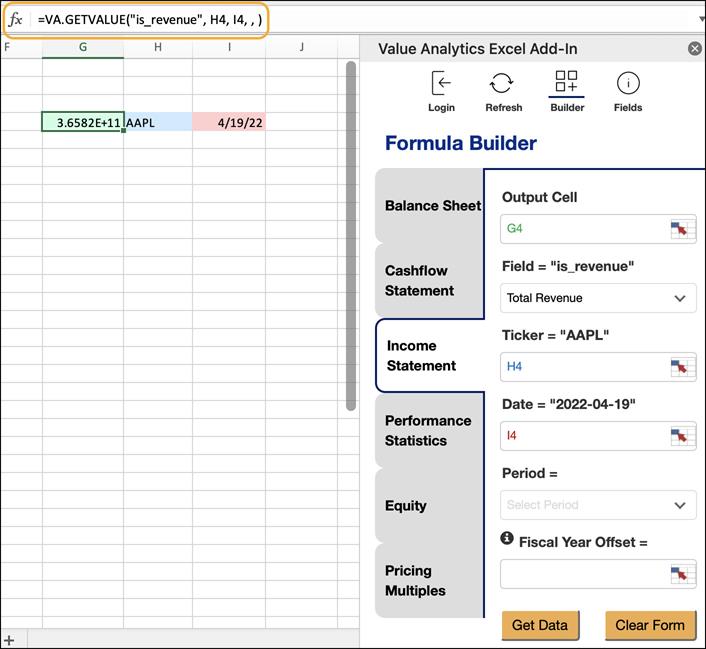
Figure 4: Properly populated Formula Builder example. The VA.GETVALUE formula is highlighted.
Pressing the Get Data button on the Formula Builder form will populate the Output Cell with data specified by the input values. The Formula Builder also creates the VA.GETVALUE formula within the formula bar of the Output Cell (Figure 4). VA.GETVALUE has the following syntax:
VA.GETVALUE(Field, Ticker, Date, Period, Fiscal Year Offset)
Once you become familiar with the VA.GETVALUE syntax, you can call the function directly without using the Formula Builder. VA.GETVALUE has the same functionality as standard Excel functions, meaning you can drag the formula over multiple cells to vary the function inputs.
You can find a list of all available fields by clicking the Field Definitions button in the Add-In menu (Figure 1). The Field Definitions window provides all available fields, their definitions, and the corresponding Function Value that is input to the VA.GETVALUE function.

Figure 1: Value Analytics menu options with the Field Definitions Button highlighted.
The Field Definitions window organizes the available Fields into six categories: Balance Sheet, Cashflow Statement, Equity, Income Statement, Performance Statistics, and Pricing Multiples (Figure 2). Select a different category to change the Fields displayed in the menu.
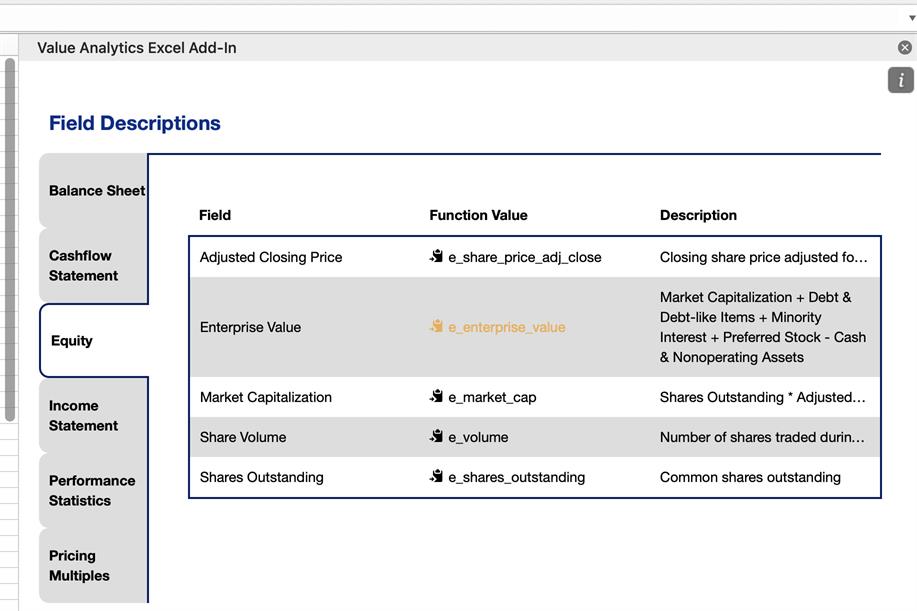
Figure 2: Value Analytics Field Descriptions page. The mouse pointer is hovering over the Field Description column in the Enterprise Value row, which expands the text in the table cell. Also, the "e_enterprise_value" text has been copied to the clipboard. The text is highlighted in gold after a value has been copied to the clipboard.
Hover over descriptions to reveal the full Description text, and click a Function Value to copy that value to your clipboard. Once the Function Value is copied to your clipboard, you can paste the Function Value directly into the VA.GETVALUE function to retrieve data corresponding to that field.
Once data has been retrieved from the Value Analytics server, the data is stored within the Excel sheet. We store the data within the Excel Sheet so that you will not have to wait for the data to be retrieved from the server when the file is opened. You can refresh the data within the Excel Sheet by pressing the Refresh button in the menu (Figure 1), and then the Refresh button in the window that opens (Figure 2).

Figure 1: Value Analytics menu options with the Refresh button highlighted.
Most of the time, the refreshed data will be identical to the data stored within the Excel Sheet. However, financial data can change when companies issue corrections. We recommend that you refresh data prior to using data from Value Analytics in official reports, so that the reported information is up to date. You will see a "BUSY" prompt within the cells while the Add-In is retrieving data from the server. If you are retrieving a large number of values during the refresh (i.e. thousands of values), it may take a moment for the refresh to complete.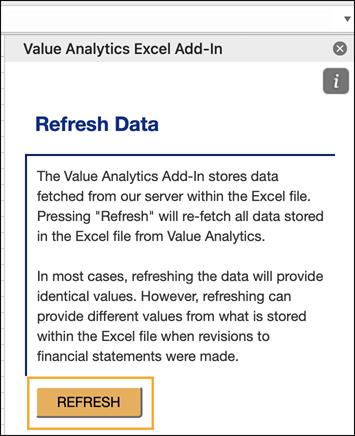
Figure 2: Value Analytics Refresh page. Press the highlighted button to refresh data.
If the Add-In is not behaving as expecting, you can reload the Add-In by:
- Clicking any button in the Value Analytics tab to open the task pane
- Clicking the information icon in the top-right
- Selecting "Reload" from the drop down menu
Figure 1 shows the "Reload" option for Mac versions of excel. Reloading the Add-In will install the latest version of the software from our servers and ensure that your installed version is up-to-date. If you are still experiencing unexpected behavior, please contact us at support@valueanalytics.org.
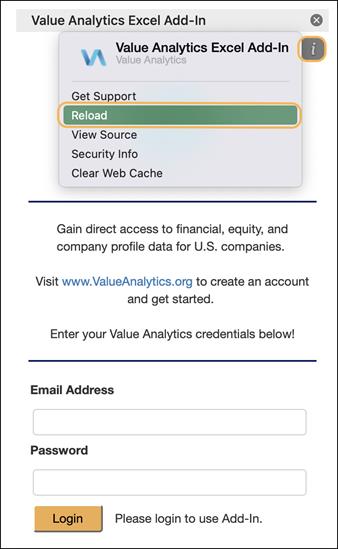
Figure 1: Value Analytics task pane with information button and reload options highlighted. Press "reload" to install the latest version of the Add-In.
For some Add-In updates, it may be necessary to re-install the Add-In to load new functionality. You can reinstall the Add-In by first navigating to the Insert tab in the Excel ribbon, and then clicking My Add-ins (Figure 1).

Figure 1: Excel Ribbon with Insert tab and My Add-ins highlighted.
Next, navigate to the My Add-ins tab of the Office Add-In page, and select the three dots on the right side of the Value Analytics Add-In (Figure 2).

Figure 2: Office Add-In page with My-Addins tab highlighted.
From the menu that opens after selecting the three dots, select "Remove" and confirm in the following dialogue box. After the Add-In was successfully removed (the Value Analytics tab will no longer be visible on the ribbon), close the Excel Application.
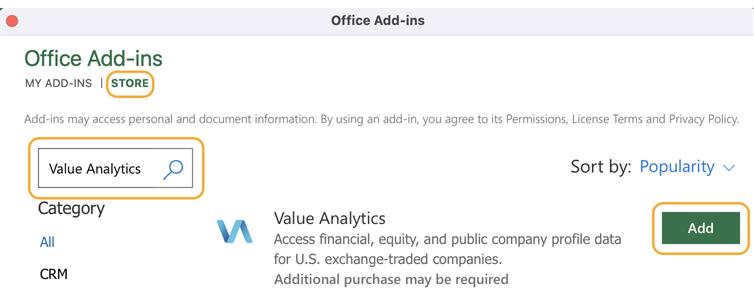
Next, re-open Excel and navigate back to the Office Add-Ins page (Figure 1). From the Office Add-Ins page, select the Store tab and type "Value Analytics" in the search field. Find the Value Analytics Add-In within the search results and select Add (Figure 3).
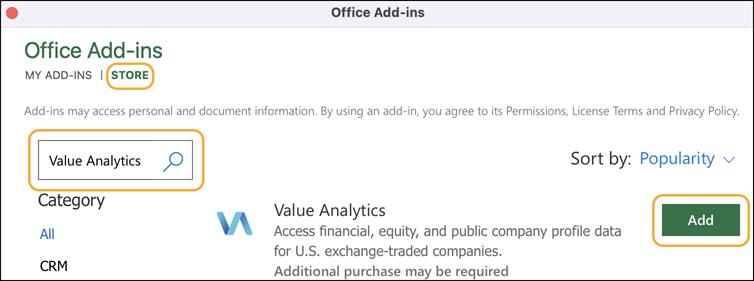
Figure 3: Add-In window with Store tab with search field highlighted.
The Office Add-In store will inform you that you agree to our terms and conditions by continuing with the installation. Press Continue to finish installing the Add-In. If the installation was successful, the Value Analytics tab will be added to the Excel ribbon and you will see the following alert (Figure 4).

Figure 4: Excel Ribbon with Value Analytics tab highlighted after successful installation.
If the Add-In is not behaving as expected following the re-installation, please contact support@valueanalytics.org