EBITDA Multiples Fall in 2Q 2020—Explore More Industry Multiples in the DealStats Value Index
When business appraisers evaluate a company, they look at how much others have paid for similar businesses relative to various earnings measures. The most commonly used valuation multiple is selling price divided by earnings before interest, taxes, depreciation, and amortization (EBITDA).
Business Valuation Resources recently published EBITDA multiples by industry in our DealStats Value Index (DVI). DVI presents an aggregated summary of valuation multiples and profit margins for over 40,000 sold private companies listed in our DealStats platform. Below are some of the highlights from the most recent report, 3Q 2020.
EBITDA Multiples Fall in the Second Quarter of 2020
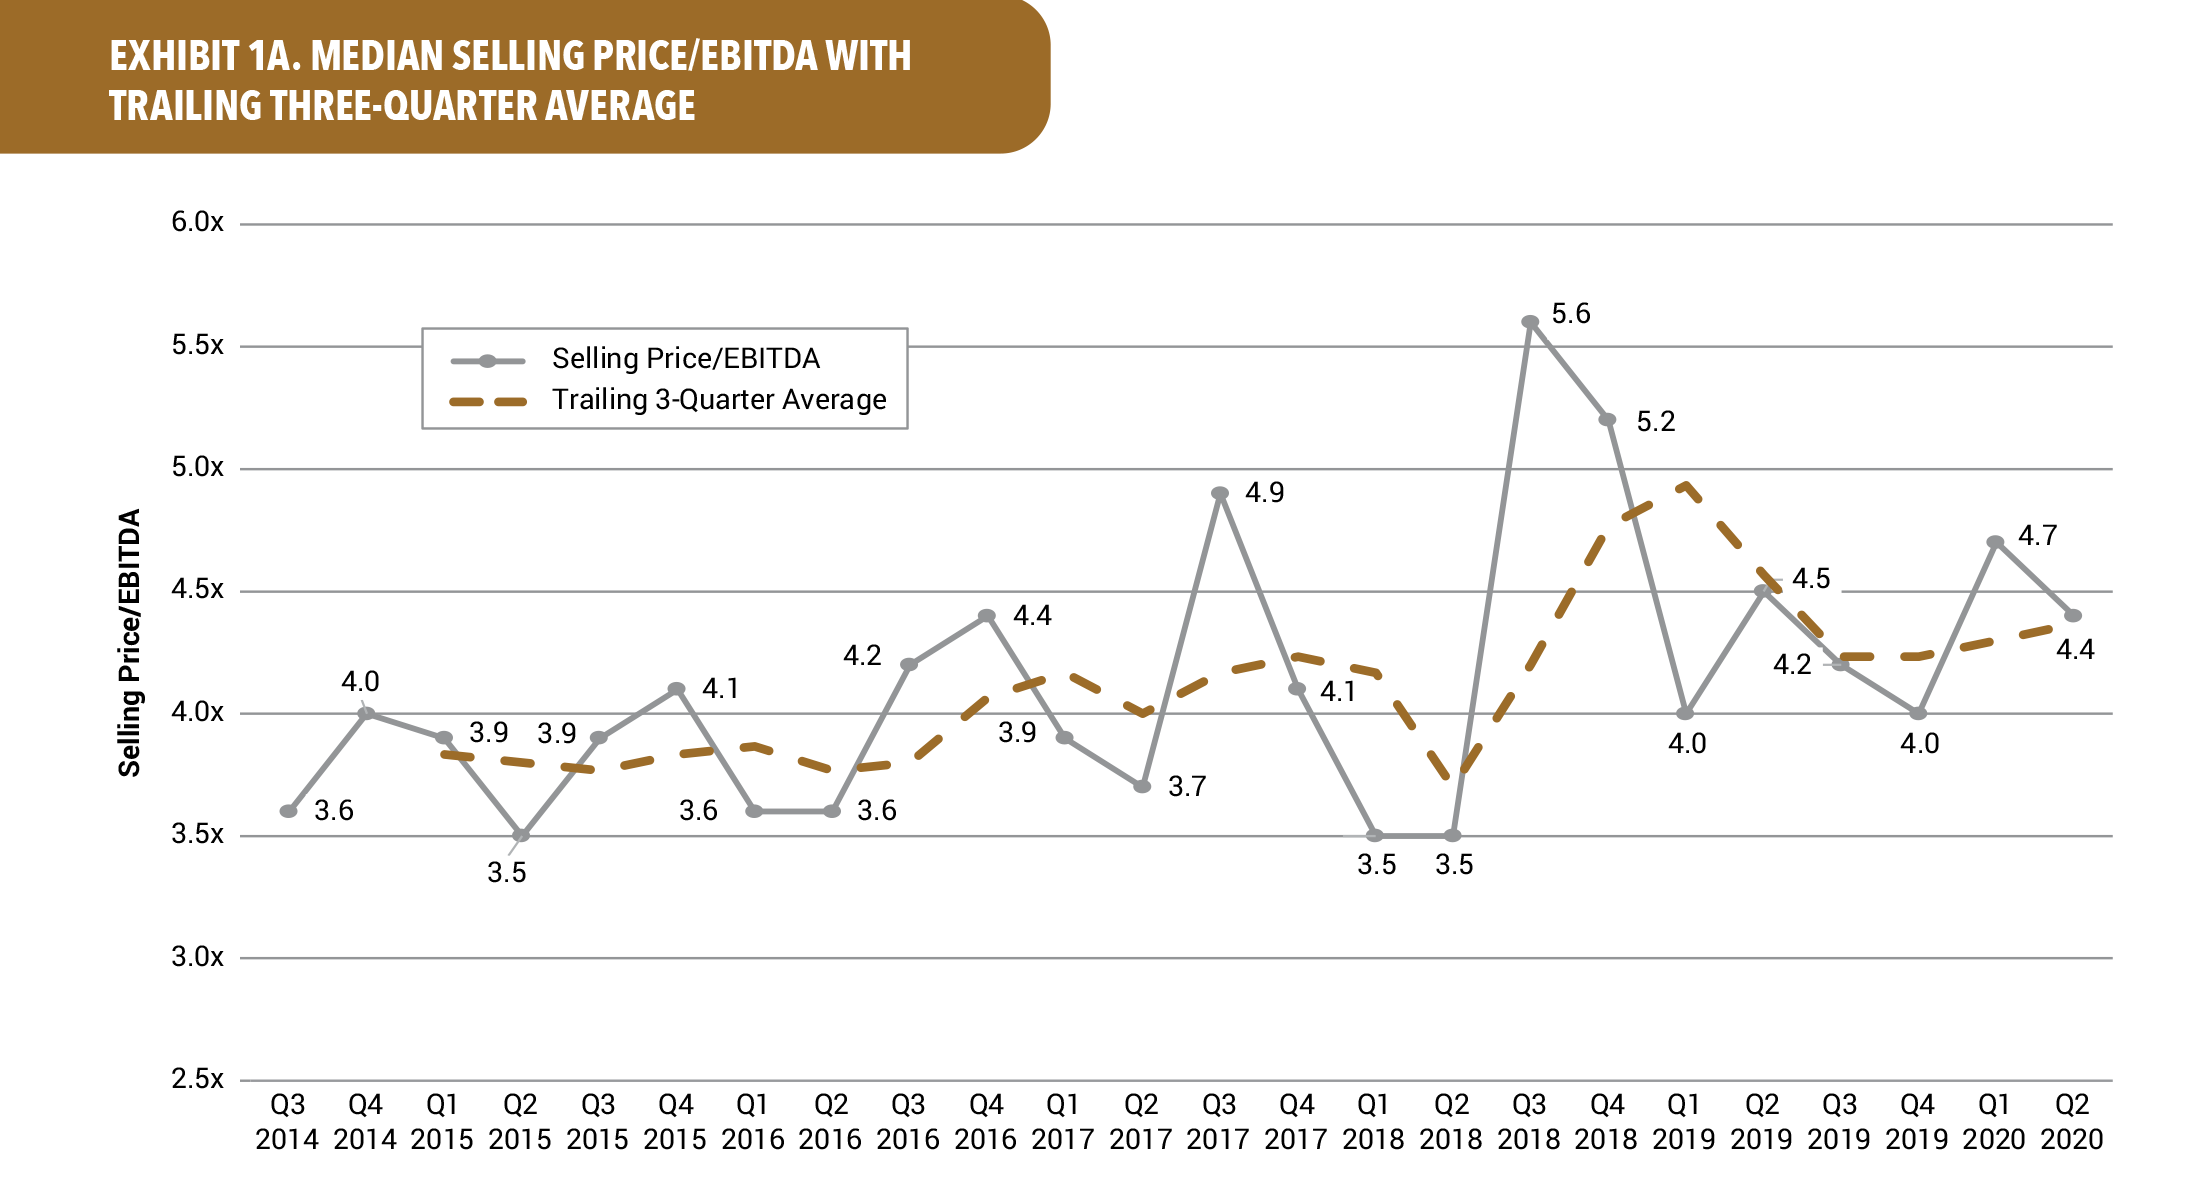
With the coronavirus pandemic affecting small businesses across the U.S. throughout the second quarter of 2020, EBITDA multiples moved lower across all industries, coming in at 4.4x. The decline to the median EBITDA multiple in the second quarter of 2020 was representative of the impact that the coronavirus had on the economy during the quarter, as the multiple in the first quarter of 2020 (prepandemic), 4.7x, was the highest multiple to start a year over the five-year period highlighted in the chart below. The trailing three-quarter average has smoothed out over the past three quarters when compared to the period between the first quarter of 2018 and the third quarter of 2019, with large swings highlighting the volatility in the prior quarters’ EBITDA multiple.

Net Sales Multiple Rises to 0.61X in the 2Q 2020
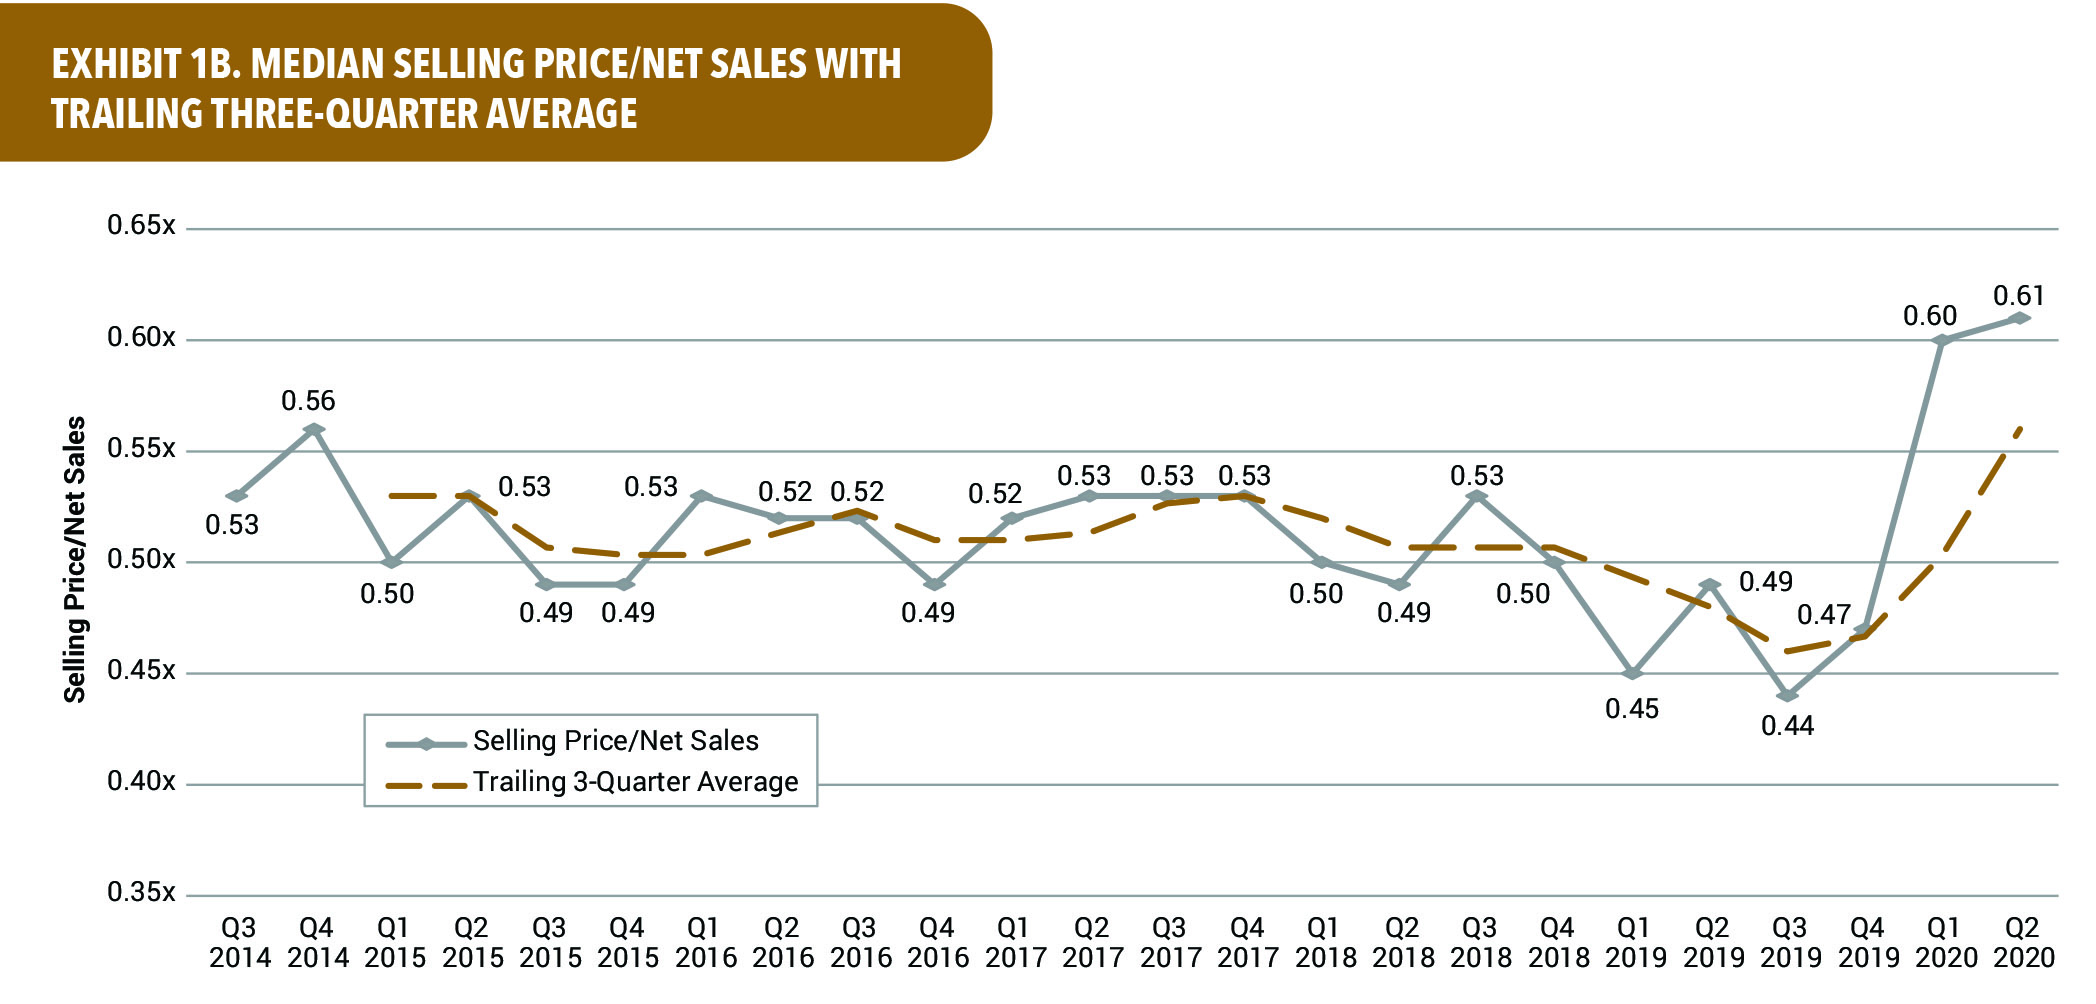
In the second quarter of 2020, the net sales multiple rose to its highest level over the six-year period highlighted in the graph below, at 0.61x. The net sales multiple in the second quarter of 2020 coincides with the peak of the economic crisis that resulted from the nonessential business lockdown caused by the coronavirus pandemic. The net sales multiple, at 0.61x, appears to indicate that the selling price remains similar to prepandemic prices despite the net sales figure appearing to be slowing as a result of the lockdown. In the period just prior to the pandemic, from the fourth quarter of 2018 through the fourth quarter of 2019, the net sales multiple had been trending lower, evident by declines in three of the subsequent quarters, as well as the trend line capturing the current quarter’s rate trending lower than the trend line highlighting the trailing three-quarter average. During this period, the net sales multiple also reported at its lowest level, 0.44x, in the third quarter of 2019. The trailing three-quarter trend line best captures the downward trend from the fourth quarter of 2017 to the fourth quarter of 2019. In the time period prior, from the first quarter of 2016 through the fourth quarter of 2017, the net sales multiple remained relatively smooth, except for a minor decline in the fourth quarter of 2016.

EBITDA Multiples Reach 10-Year Highs Through the 2Q 2020
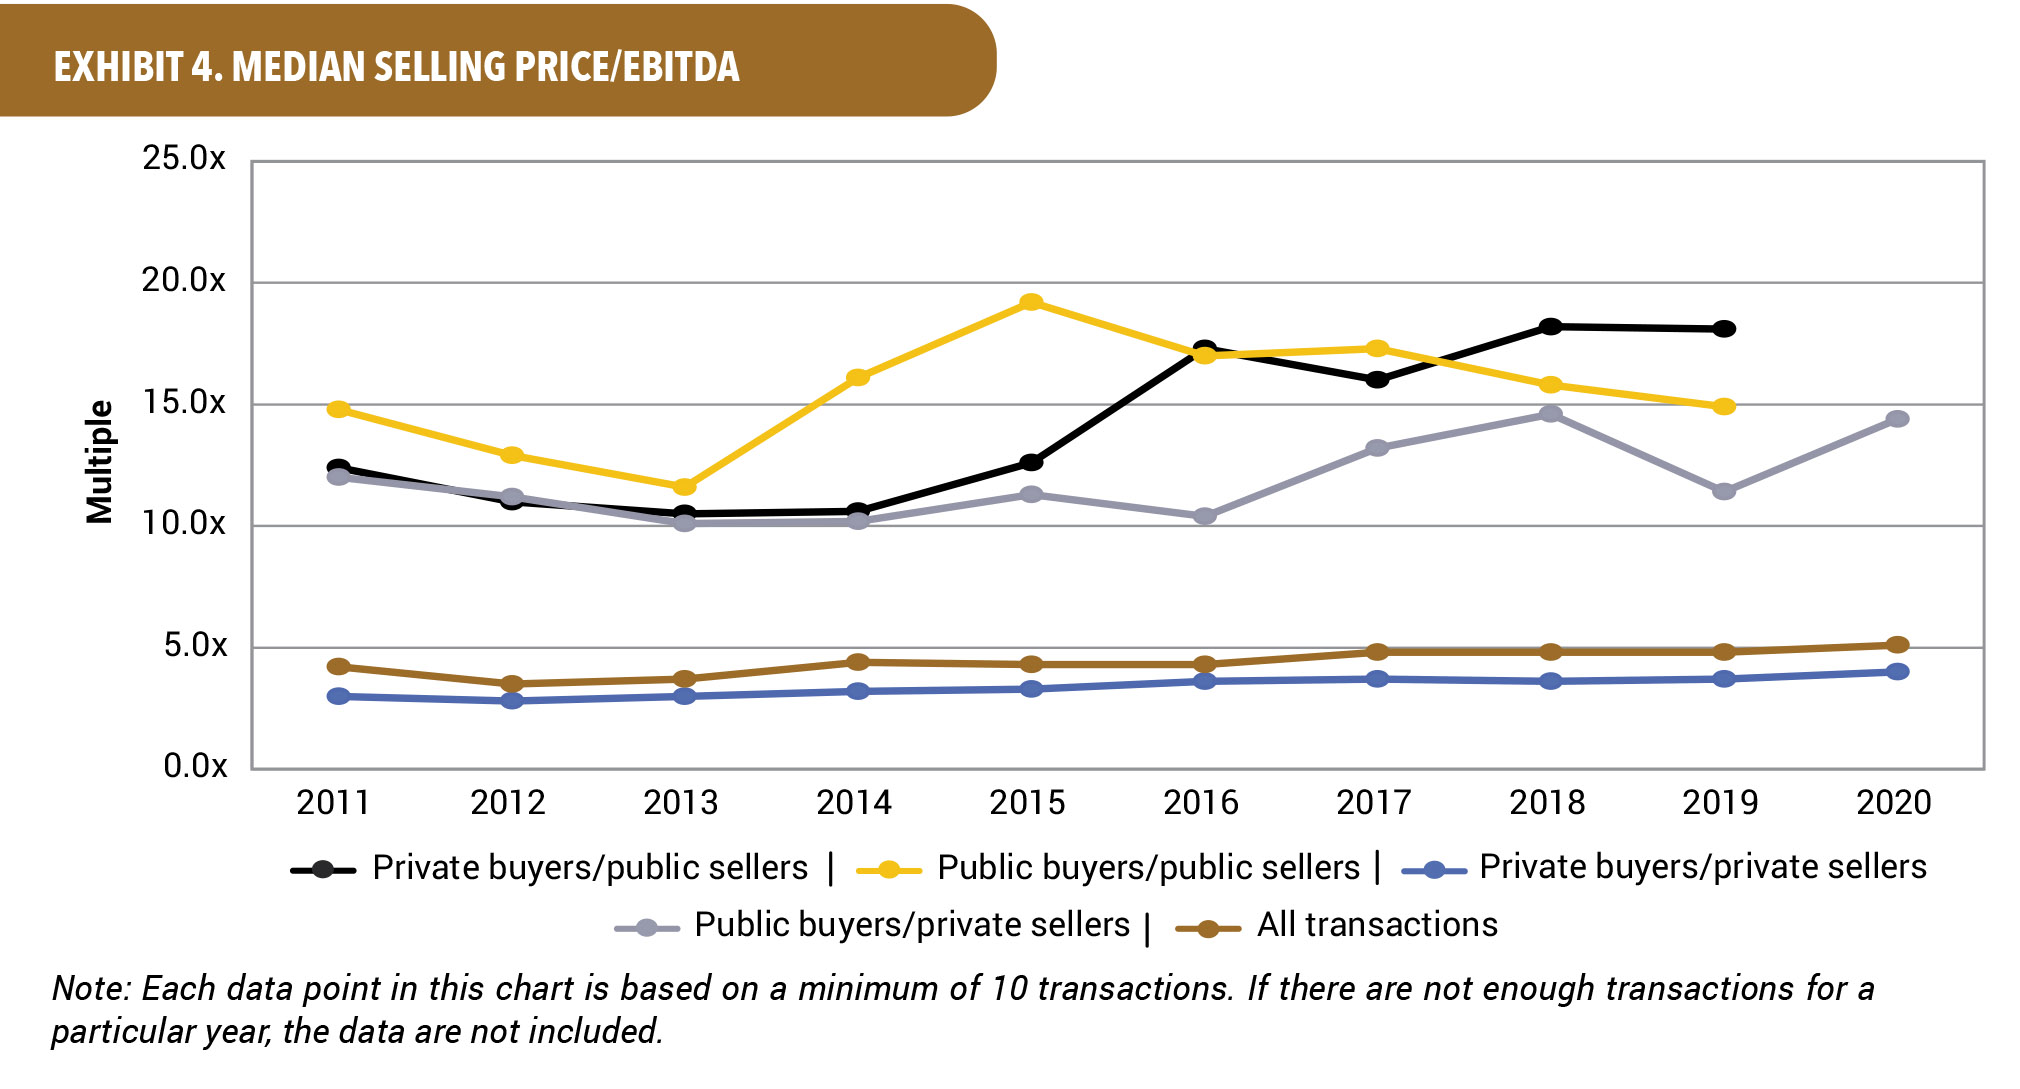
Through the second quarter of 2020, EBITDA multiples were at 10-year highs in two of the categories that met the minimum number of transactions criteria. Public-seller transactions have yet to meet the minimum transaction criteria to be included in the chart below at the time of publication. The private buyer/private seller category saw its EBITDA multiple rise to 4.0x, while the public buyer/private seller category rose to 14.4x. The all transactions category was 5.1x. The trend in 2019 saw public buyers paying a lower EBITDA multiple, 14.9x, than in the year prior, when they paid 15.8x, which also marked the second consecutive year the EBITDA multiple declined. Private buyers of public targets paid a higher multiple than their public buyer counterparts in 2018 and 2019, at 18.2x and 18.1x, respectively. This trend also occurred in three of the past four years. DealStats will monitor whether this trend continues into 2020. EBITDA multiples for all transactions remained at 4.8x from 2017 to 2019 but has continued to trend higher in 2020, coming in initially at 4.9x through the first quarter of 2020 and rising to 5.1x through the second quarter of 2020.

Get More Analysis and Trends from Private-Company Deals
For more analysis and trends, download an excerpt from the 3Q 2020 DealStats Value Index, a quarterly summary available exclusively to subscribers of DealStats, a platform with financial details on over 40,000 private and public deals. You can also sign up for the free ezine that digests portions of the complete report each month.
