How much have others paid for similar businesses? Explore industry multiples in the DealStats Value Index
When business appraisers evaluate a company, they look at how much others have paid for similar businesses relative to various earnings measures. The most commonly used valuation multiple is selling price divided by earnings before interest, taxes, depreciation, and amortization (EBITDA).
Business Valuation Resources recently published EBITDA multiples by industry in our DealStats Value Index (DVI). DVI presents an aggregated summary of valuation multiples and profit margins for nearly 40,000 sold private companies listed in our DealStats platform. Below are some of the highlights from the most recent report.
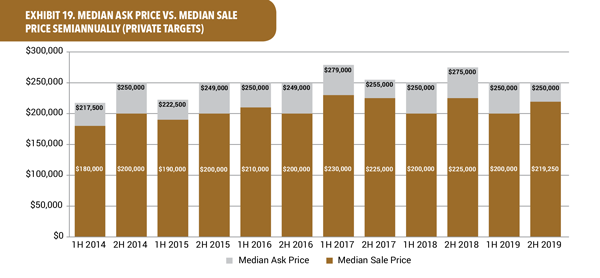
2019 sale price in favor of sellers with smaller discounts
In this chart, DVI compares the median asking price with the median sales price for private targets since 2014. In the second half of 2019, momentum shifted in favor of sellers, as buyers paid an average of 87.7% of the asking price. Over the five-year period from 2014 to 2019, the percentage of asking price has ranged from 80.0% (2H2014, 1H2018, and 1H2019) to 88.2% (2H2017).

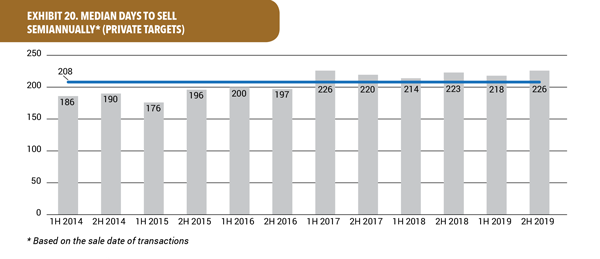
Days to sell rise to a five-year high
The median number of days to sell for private targets tied its highest point in the period analyzed, at 226 days to sell in the second half of 2019, which was last reached in the first half of 2017. Since this time, the median number of days to sell has remained above the five-year median, coming in at 208 days through the second half of 2019, as shown in Exhibit 20.

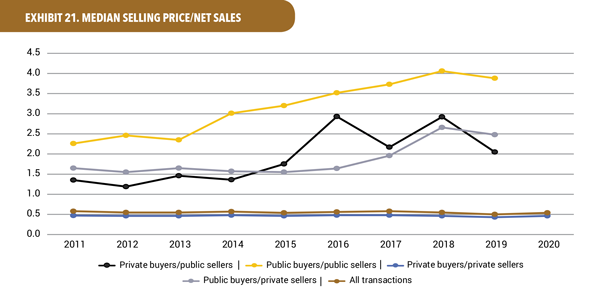
Net sales multiples rise in the first quarter of 2020
The private buyers of private sellers and the "All Transactions" category saw their net sales multiples rise in the first quarter of 2020, to 0.46x and 0.54x, respectively. The rise in the first quarter reversed the trend that saw the net sales multiples across all five categories decline in 2019, with the private buyer/private seller and the "All Transactions" categories falling to 10-year lows, at 0.43x and 0.50x each. The private-buyer-to-public-seller net sale multiple fell to a five-year low in 2019, 2.05x.

Get more analysis and trends from private-company deals
For more analysis and trends, download the complete "2Q 2020 DealStats Value Index," a quarterly summary available exclusively to subscribers of DealStats, a platform with financial details on nearly 40,000 private and public deals. You can also sign up for the free ezine that digests portions of the complete report each month.
