Key Updates and Insights in the U.S. Economy
Having a firm grasp on the current state of the economy is vital to any business valuation engagement. Business valuation experts and many other industry professionals rely on economic indicators as a key point of reference in their work. Economic factors can have a significant impact when valuing businesses, evaluating mergers and acquisitions, and a variety of other financial analyses.
BVR’s Economic Outlook Update (EOU) monthly and quarterly reports examine the general U.S. economic climate. In our most recent monthly report, we provide an overview of some selected economic factors that prevailed as of August 2019, as well as a discussion of the factors that are crucial over an extended period. Highlighted below are some of these important factors including manufacturing, Consumer Price Index, unemployment, and more.
Retail and Food Services
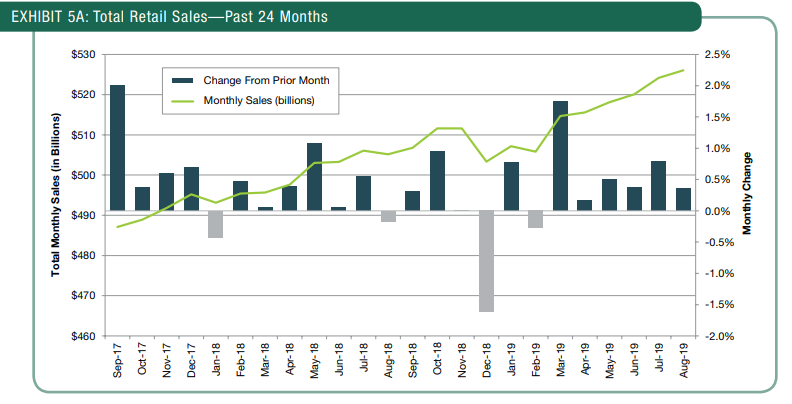
U.S. retail and food services sales increased 0.4% in August, after gaining 0.8% in July. Consumers became slightly more cautious in their spending due to the escalation in the trade war between the U.S. and China. Higher sales of cars and sales over the internet contributed to the rise in August.
Retail sales figures over the past 12 months increased 4.1%. Sales at nonstore retailers advanced 16.0%, motor vehicle and parts dealers by 6.8%, and miscellaneous store retailers by 4.7%.
Core retail sales increased 0.1% in August. The core retail sales figure excludes sales of automobiles, gasoline, building materials, and food services and corresponds most closely with the consumer-spending component of gross domestic product. Over the past 12 months, core retail sales have grown 4.2%.
Unemployment
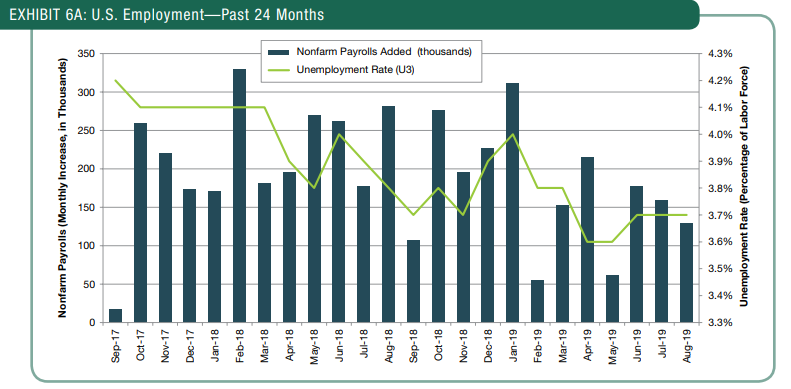
Total nonfarm payroll employment increased in August, adding 130,000 jobs. Growth did slow down, however, as the June figures were revised down from 193,000 jobs to 178,000 jobs and July’s figures were revised from 164,000 jobs to 159,000 jobs. As a result, there were 20,000 less jobs over the two-month period than originally reported. In addition, a large portion of the gains in August were attributed to the hiring of temporary workers for the census and private payrolls grew by the smallest pace since February.
The White House Council of Economic Advisors published a report that stated that, over the past 33 months, or since the election, monthly job gains have netted over 100,000 jobs per month in 30 of the months. The Council of Economic Advisors further noted that the total number of unemployed stood at 6 million in July 2019, a figure well below the 14 million as of July 2009, which marked the beginning of the current economic expansion.
Manufacturing, Services, and Industrial Production
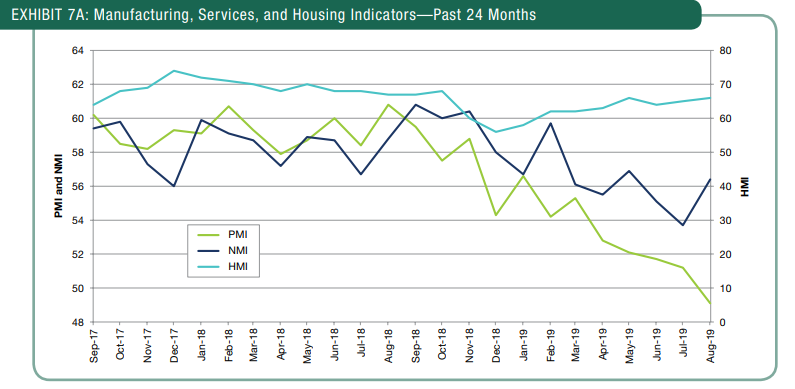
The manufacturing sector decreased for the fifth consecutive month, falling 2.1 percentage points in August, as reported by the Institute for Supply Management (ISM). The manufacturing index (PMI) score in August was 49.1%, a rate that is lower than its 12-month average of 54.4% and the lowest level since January 2016. The continued decline of the index, which has gradually fallen since August 2018, has now reached levels indicating a contraction in the manufacturing economy. As a result, only two of the “Big Six” industries expanded and three contracted.
Consumer Price Index
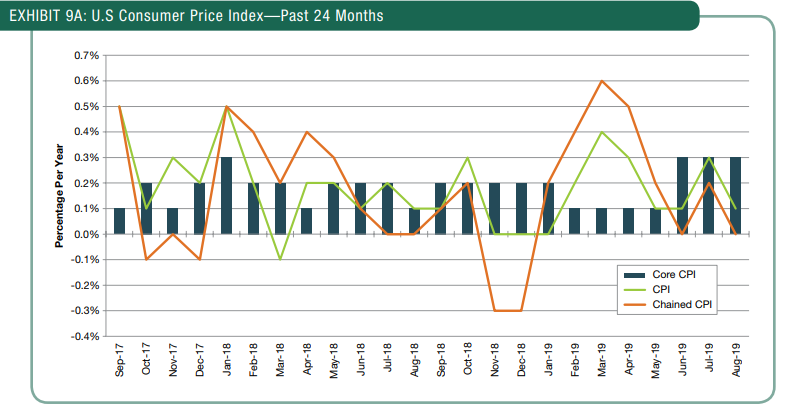
Consumer prices increased 0.1% in August, after rising 0.3% in July. The modest increase was the result of a big drop in the cost of gasoline and other energy products. Over the past 12 months, the Consumer Price Index is up 1.7%. The Chained Consumer Price Index for all urban consumers remain unchanged in August after rising 0.2% in July. Over the past 12 months, the index has risen 1.7%. The Chained Consumer Price Index was designed to be a closer approximation of a cost-of-living index in that it, in its final form, accounts for any substitution that consumers make across item categories in response to changes in relative prices.
Personal Consumption Expenditure
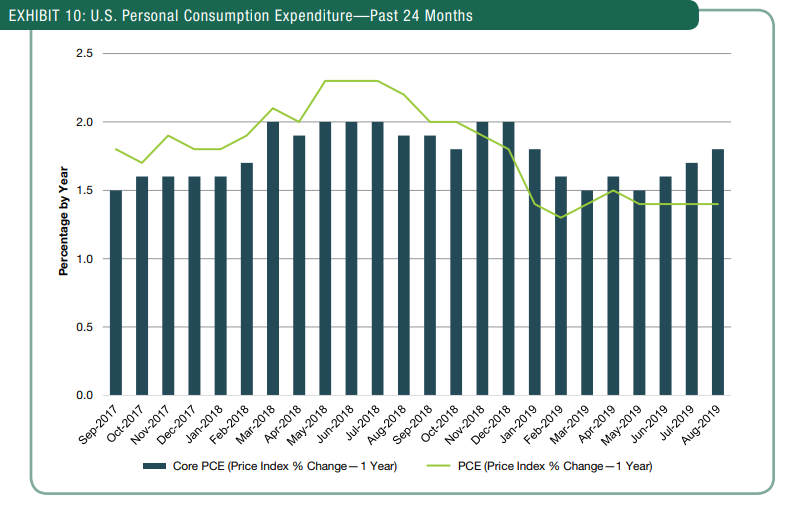
The Federal Reserve often emphasizes the price inflation measure for personal consumption expenditures (PCE), which the Department of Commerce produces, largely because the PCE index covers a wide range of household spending and is less volatile than some other measures. Prices, as measured in current dollars highlighted in the August report, increased 0.1% after increasing 0.5% in July.
The PCE price index remained unchanged in August, after rising 0.2% in July. Core PCE, which excludes the volatile food and energy components, increased 0.1% in August, after rising 0.2% in July. From August 2018 to August 2019, the PCE price index is up 1.4% and core PCE has risen 1.8%. Core PCE, which is the Federal Reserve’s preferred inflation measure, remained below the Federal Reserve’s long-term rate, 1.99%, and below the U.S. central bank’s 2.0% inflation target.
Free Economic Outlook Update Sample Issue
To see all of the economic factors covered in the Economic Outlook Update, including general economic conditions, gross domestic product, consumer prices and inflation rates, energy prices, interest rates, unemployment, consumer spending, the stock and bond markets, construction, manufacturing, real estate markets, and the future economic outlook, download a free sample issue.

