How did surging stock prices affect M&A premiums all buyers paid in 2017?
Although M&A activity slowed in 2017 compared to previous years, activity remained robust overall. Following the rebound from the financial crisis of 2009, stock markets have experienced the longest economic expansion in history, with all major indexes surging to record highs. So, while investors may have reaped financial gains, how did surging stock prices affect M&A premiums all buyers paid in 2017?
Use the 2018 Mergerstat Review to track takeover premiums
The Mergerstat Review highlights acquisition premiums paid using the seller’s five-day stock price prior to the announcement of the transaction, or essentially the premiums based on the equity value of the seller. Looking at the trends across all transactions, the numerous tables and charts in the Mergerstat Review show that premiums have steadily declined in most of the past five years. Premiums have also nearly unanimously declined across all charts and tables featuring premia information among 2017 transactions. In essence, as stock prices have risen, buyers have paid a lower per-share takeover price to acquire a selling business.
What’s new in the 2018 Mergerstat Review?
One of the major changes to the 2018 Mergerstat Review is that, while transaction premiums still feature the premium paid for the targets’ share prices five days prior to the announcement, the publication now has four new tables that focus on premiums paid over the targets’ enterprise values:
- Table 1-25 features premiums over enterprise value categorized by deal size;
- Table 1-26 focuses on the premiums paid comparing public to private buyers, where, for the first time in five years, private buyers paid a higher premium than public buyers; and
- Tables 2-10 and 2-11 feature the average and median premiums paid over the enterprise value and are analyzed by year and by sector.
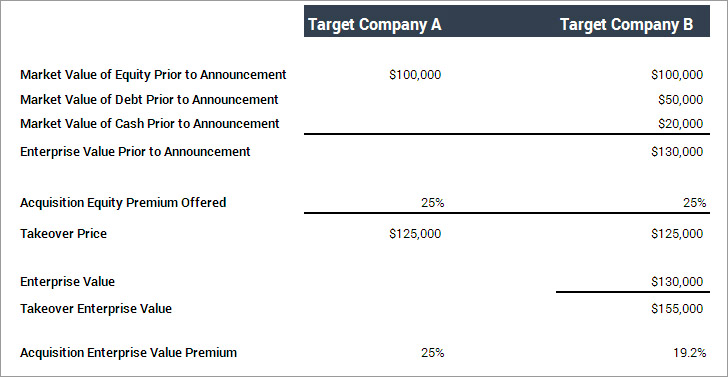
The inclusion of these premiums differ from the five-day equity premiums that have been historically captured in the publication because the data now take into consideration the fact that not all comparable companies have the same capital structure, thus adding the sellers’ debt while subtracting the sellers’ cash, once the transaction is completed. The premise is that the greater a seller company’s leverage, the less cash or acquirer’s shares an acquirer needs to control the target enterprise. As an example of the calculation, see below for a snapshot that compares two companies with the same equity structure and premium paid. Company B illustrates how the seller’s debt and cash factor into the adjustments in the calculation of the premium.

To further illustrate this point, using a transaction from the 2018 Mergerstat Review, the acquisition of C.R. Bard by Becton, Dickinson & Co. for $24.9 billion in the health technology sector displays all three premiums as discussed above. The premium paid for this specific transaction is featured in the Transaction Roster (found in Part 4 of the publication), while the graphic also includes the premia average for the sector as well as the average for the premium paid over enterprise value (both found in Part 2).

In a comparable transaction analysis focusing on sector premiums, the Mergerstat Review provides the beginning framework to compare this specific transaction with the industry average, other transactions in the industry, and now the premium paid over enterprise value as benchmarks.
For more information about what’s new in the Mergerstat Review, download the FAQs.

