
EBITDA multiples by industry: New statistics on private-company selling prices
One way business appraisers evaluate a company is to look at how much others have paid for similar businesses relative to various earnings measures. Selling price divided by EBITDA (earnings before interest, taxes, depreciation, and amortization) is a commonly used valuation multiple. Business Valuation Resources recently published EBITDA multiples by industry from a study of over 30,000 sold private companies listed in the DealStats database. Let’s dive into the highlights from the analysis.
For additional insights on private company deals download BVR’s 3Q2018 DealStats Value Index Brief.
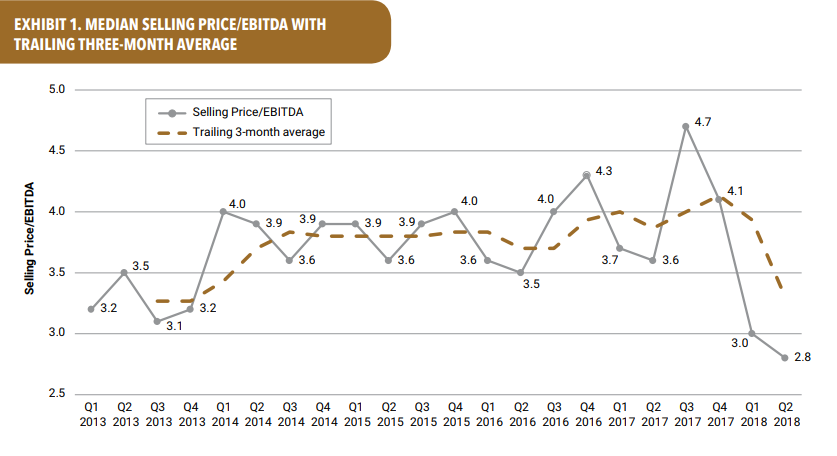
EBITDA multiples are declining
While EBITDA multiples across all industries were highest over a five-year period in the third quarter of 2017, at 4.7x, in the second quarter of 2018, these multiples plummeted to 2.8x—the lowest level over the same five-year period. The relatively steady trailing three-month average trend line from the third quarter of 2014 through the first half of 2017 gave no clear indication that large fluctuations in multiples paid would ensue in the quarters ahead. From the third quarter of 2017 to the present, EBITDA multiples have trended down, marking the largest decline reported in recent years.
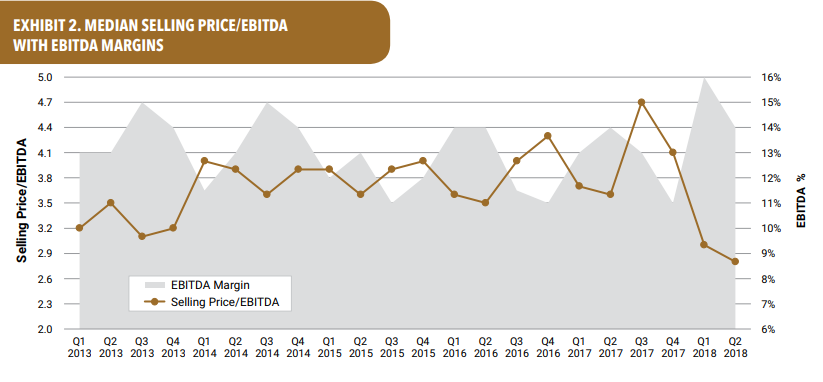
EBITDA margins on the rise
EBITDA as a percentage of revenue peaked most recently in the first half of 2018, while the selling price-to-EBITDA multiple fell to its lowest level (2.8x) in the second quarter of 2018. Prior to 2018, the peaks and valleys of the EBITDA multiple moved opposite to that of the EBITDA margins. DealStats is tracking the trend to see whether it continues.
Which industry sectors have the highest EBITDA multiples?
The study found that EBITDA multiples are highest for the information sector (11.1x) and the mining, quarrying, and oil and gas extraction sector (8.6x). Meanwhile, the lowest EBITDA multiples are in the accommodation and food services (2.5x) and the other services sectors (3.0x). The median across all industry sectors is 3.0x.
  |
Access EBITDA multiples for additional industries Download the 3Q2018 DealStats Value Index Brief for additional statistics and trends from private company deals, including selling price/EBITDA for major industry sectors:
|
Need a more precise valuation multiple? Access a custom set of comparable transactions in the DealStats platform. Search over 34,000 private and public deals in 922 industries and drill down to a group of sold companies similar to the business you’re evaluating. View transaction details and statistics on up to 164 data points, including valuation multiples, purchase price allocations, financial statements, and deal structures.